
A Structured Approach to Evidence-Based System Investigation
Introduction
Systemic investigation is hard. For a single host, you can look at over a terabyte of data, and literally millions of lines in a super timeline. That’s an insane amount of data, and without a structured, repeatable investigation process, you’re going to take weeks to complete the review, or miss stuff (or in my case, both!).
When I worked at Mandiant, the general expectation was that we would complete a thorough review of at least one host each day - and missing attacker activity in the high-stakes investigations we worked on was not an option. While the Mandiant team are rock stars, there’s no real reason we can’t achieve this level of performance with enough practice - and the right approach.
General Theory
There are two key investigative methods you can follow when looking at a system, and the lead you’re following will determine which is appropriate. The first is Intel-driven investigations, which will be the topic of a future blog post. TL;DR, you use this where you don’t suspect interactive activity on a system.
The second, and the method we’re discussing today, is evidence-based investigations. In these investigations, you take a lead and run with it, pivoting over all available evidence and subsequent leads until you can say you’ve enumerated everything possible the attacker did on the system. At a very high level, you break your leads into two different types, artifacts and temporal, and you iterate over these until you run out of leads. With a little of clean up, your investigation is complete. Simples!
Artifact leads refer to any lead that exists in the system. For example, maybe our attacker (McNasty hereafter) writes mimikatz to C:\Users\install_cache\kittens\mimikatz.exe. We have the mimikatz.exe filename itself as an artifact, but we also get C:\Users\install_cache\kittens\ and C:\Users\install_cache\ - because these don’t exist on a standard system! We don’t include C:\Users\, because McNasty didn’t create this folder, so it’s not an indicator of his attack. We’ll still search this directory for additional indicators the attacker may have left behind, but we won’t report on this directory alone as an indicator of compromise.
Temporal leads are all about time. Using the example above, maybe mimikatz.exe was created at 2024-03-01T12:00:00Z. This temporal artifact allows us to expand our investigation by examining what else happened around this time - such as identifying who was logged in to the system, which processes were started, and which other files were created on disk.
There are some artifacts that are just hard to look at in a super timeline or disk image. For example, most tools do not pull out and parse a list of the files accessed as reported by prefetch, so if you find a prefetch file of interest, you will need to manually parse it for additional leads. We’re also paranoid sumbitches, and some timestamps are either crazy easy to mess with, or change with normal system usage (like registry key last modified timestamps), so we’ll perform a manual check of locations of interest, like persistence locations, out of an abundance of caution. Below, we refer to this as Search Non-Linear Locations.
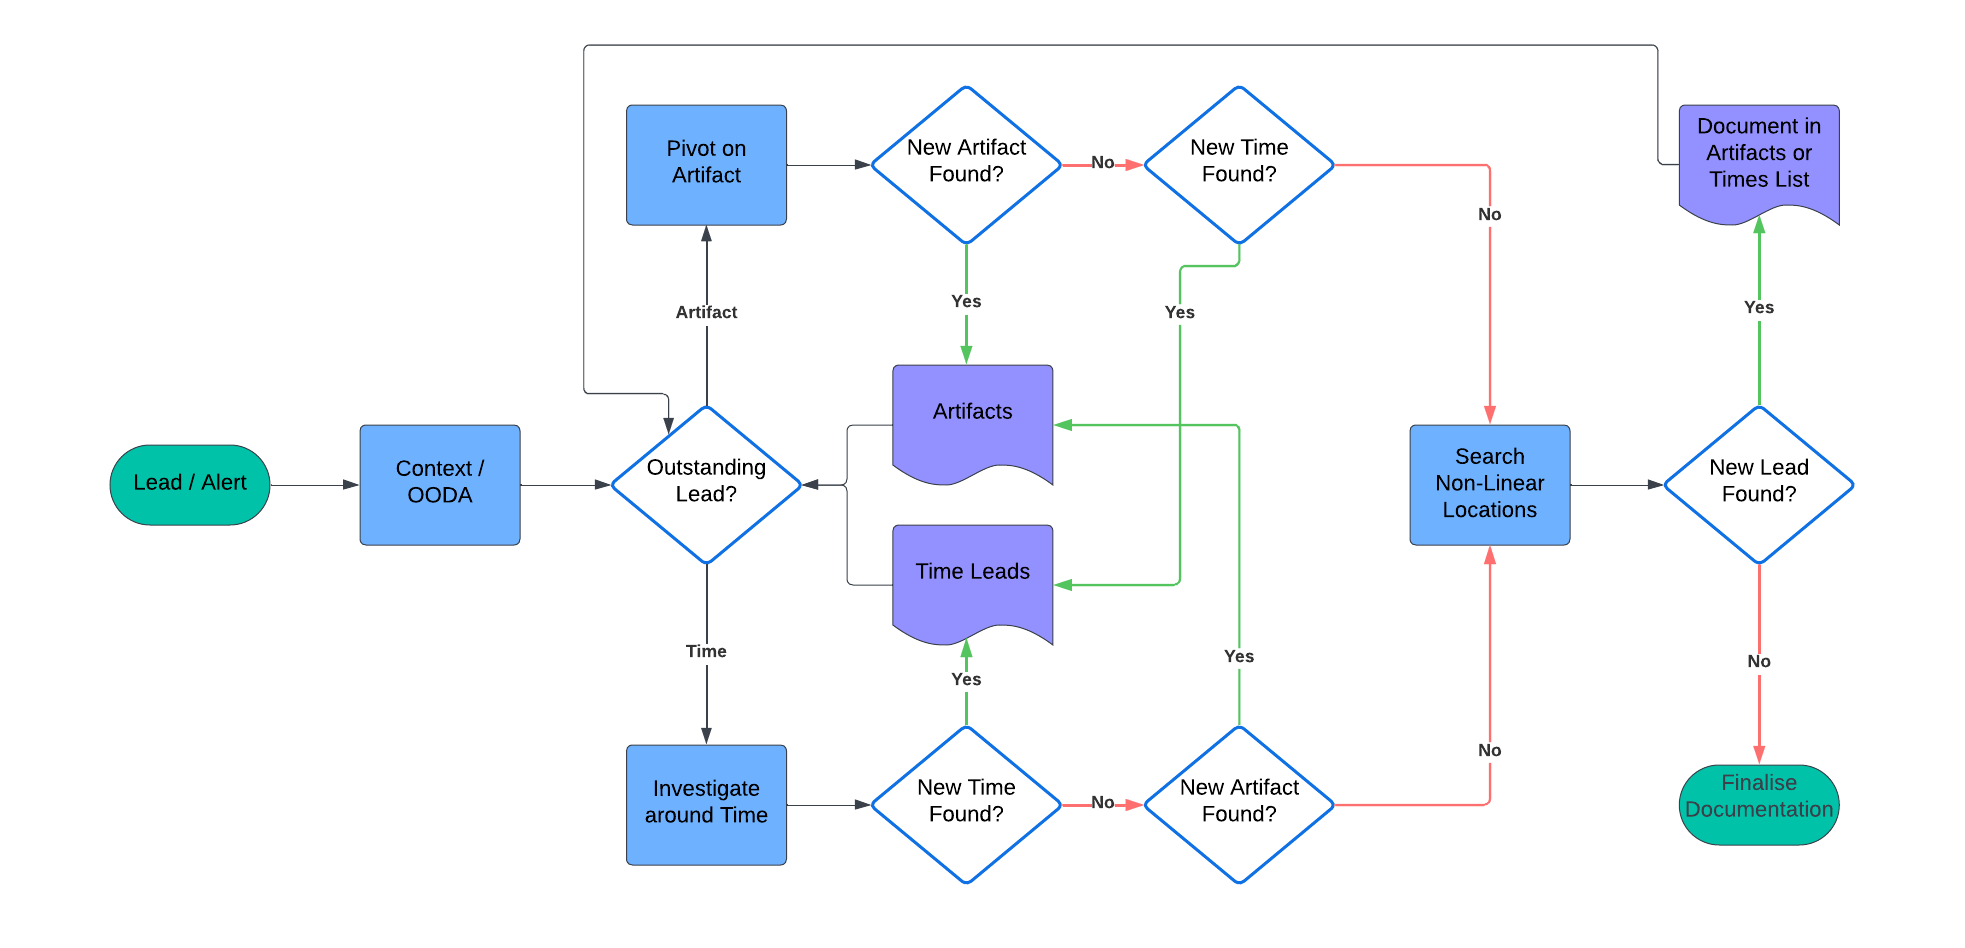
I’m a visual person, so I’ve created the flow-chart below. Take a minute to read through it, thinking about each step of the investigation, then we’ll run through an example.
Example System Investigation
It’s 4pm on Friday (because of course it is), and your investigation leader has given you a new host to investigate as part of an ongoing incident with the lead:
The file “C:\ProgramData\kav\svchost.exe” was written to disk “2017-06-13T02:57:08Z”. This activity matches that of McNasty in our environment.
You’ve run a KAPE collection and generated a timeline with plaso and log2timeline. In reviewing the timeline, you’ve found the initial lead, confirming you’re looking at the right host, and the alert wasn’t a false positive.

| Artifacts | Times |
|---|---|
| C:\ProgramData\kav\ | 2017-06-13T02:57:08Z |
| svchost.exe (not in C:\Windows\System32) | |
| md5sum(svchost.exe) |
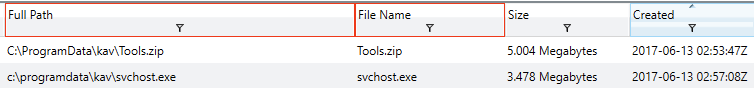
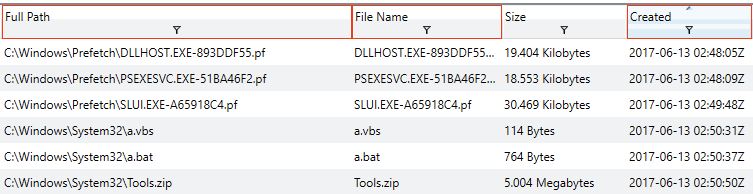
From the above list, you decide to first pivot on the C:\ProgramData\kav directory, to see if there is anything else in there that’s interesting to your investigation. You find reference to a file called Tools.zip created around three minutes before svchost.exe. Unfortunately, in checking the hash recorded for Tools.zip, you see the value d41d8cd98f00b204e9800998ecf8427e. This is the value you get when you md5 sum a null value, showing the file contents were no longer present on disk when the KAPE collection was made. The screenshot below shows a snippet of your filtered timeline, and the notes you totally updated are below that.
| Artifacts | Times |
|---|---|
| 2017-06-13T02:57:08Z | |
| svchost.exe (not in C:\Windows\System32) | 2017-06-13T02:53:47Z |
| md5sum(svchost.exe) | |
| Tools.zip |
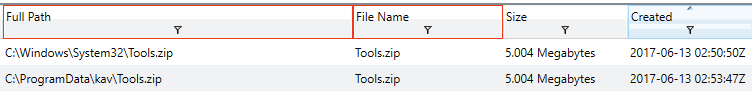
Someone deleted Tools.zip, which is a shame. You wonder if it existed anywhere else on disk, because there might be more leads in the contents! You decide to filter on that next. Unfortunately, no joy. You find another reference, this time in C:\Windows\System32. Hey, it’s something, right?
| Artifacts | Times |
|---|---|
| 2017-06-13T02:57:08Z | |
| svchost.exe (not in C:\Windows\System32) | 2017-06-13T02:53:47Z |
| md5sum(svchost.exe) | 2017-06-13T02:50:50Z |
| C:\Windows\System32\ |
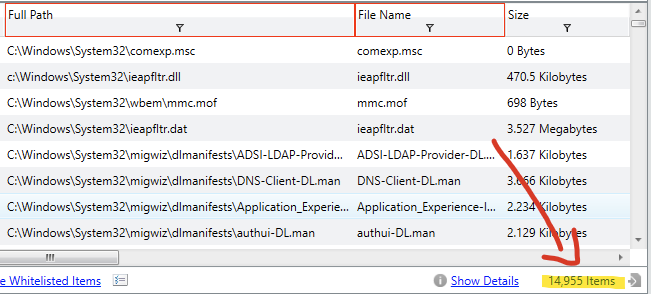
Directory pivots are working well for you so far, so you continue with them, hoping to preserve your lucky streak. This time, you filter on filepath contains C:\Windows\System32. Holy cannoli batman, that’s over 14 THOUSAND hits.
As a general rule, when I’m manually reviewing results, I get bored, my eyes glaze over, and I start missing things around the 1000 results mark. This number will probably be much higher for you, but do some experimenting and work out what your upper threshold is. Here, there are far too many results, so we need to find a better way to pare these down.
| Artifacts | Times |
|---|---|
| 2017-06-13T02:57:08Z | |
| svchost.exe (not in C:\Windows\System32) | 2017-06-13T02:53:47Z |
| md5sum(svchost.exe) | 2017-06-13T02:50:50Z |
Ok, you’re confident of your artifact based pivoting now. The concepts stay the same when you’re looking at other artifacts, like registry keys or scheduled tasks or event log messages.
Moving on to temporal analysis, I like to start with events 5 minutes before and 5 minutes after a timestamp. This results in less than 1000 hits (my magic number), and will capture process start or finish, other file writes, DNS lookups, etc. So you filter based on +- 5 minutes around 2017-06-13T02:50:50Z. Below, you can see a subset of the results.
| Artifacts | Times |
|---|---|
| 2017-06-13T02:57:08Z | |
| svchost.exe (not in C:\Windows\System32) | 2017-06-13T02:53:47Z |
| md5sum(svchost.exe) | |
| 2017-06-13T02:50:31Z | |
| 2017-06-13T02:50:37Z | |
| a.vbs | 2017-06-13T02:50:50Z |
| a.bat | 2017-06-13T02:57:07Z |
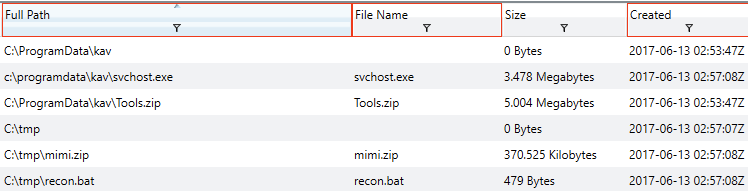
Hey look, you found some of those pesky System32 hits. Given the low number of results, we can probably broaden our time window and knock out the remaining timeframes at once. You try for 5 minutes before the first timestamp (2:50) to five minutes after the last one (2:57). The number of results is below your magic number, so you get them all done at once, yay!
| Artifacts | Times |
|---|---|
| svchost.exe (not in C:\Windows\System32) | |
| md5sum(svchost.exe) | |
| a.vbs | |
| a.bat | |
| C:\tmp | |
| mimi.zip | |
| recon.bat |
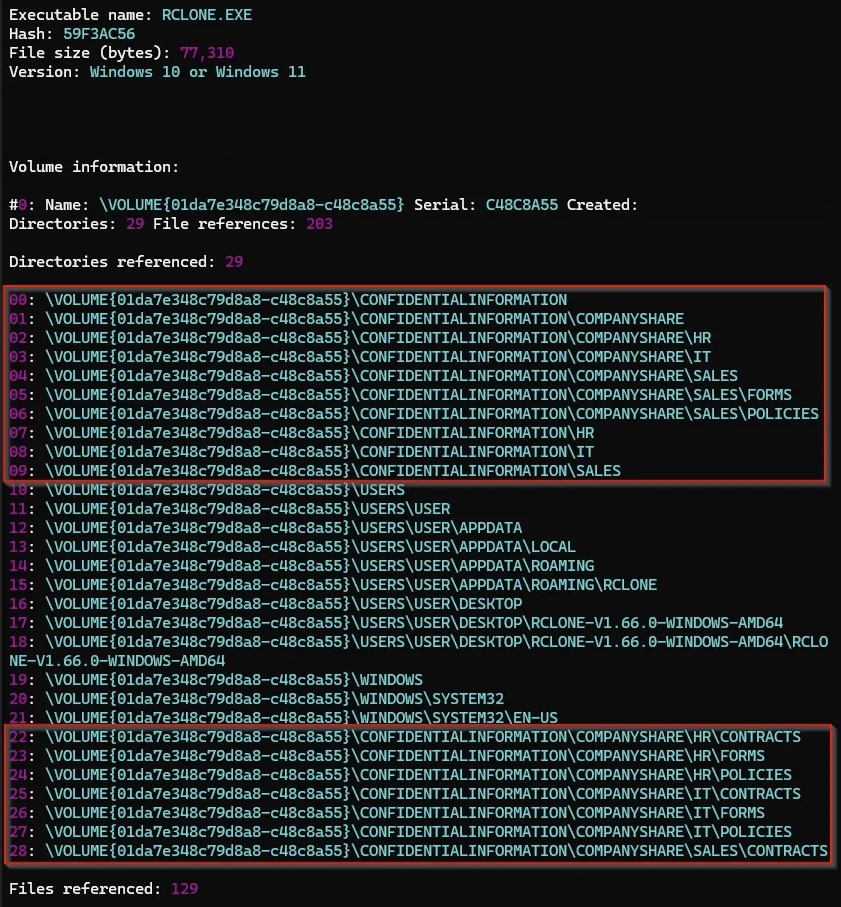
Those time pivots gave you brand new artifact leads to pivot off of. Hooray! I think you get how this works now, so let’s skip through to our non-linear search. Here, we found evidence of rclone being used. A manual review of the prefetch file shows additional artifacts that we may or may not want to pivot off. Example below.
Conclusion
And that’s it! Once you have run out of leads to follow and inspected non-linear locations, you have finished your investigation. At that point, you can say with high confidence you’ve enumerated all attacker activity on the system. Well done!
There’s a small caveat in that the above scenario we only looked at file creation times. Many filesystems have multiple timestamps for a single file - created, modified, last accessed, etc. These lists can get huge, and there’s nothing wrong with bundling timestamps that are only a few seconds apart together - it will generally make no practical difference.
Credits
Huge thanks to Mandiant for their EIR 2017 training, the scenario for which I used in the above story.
Also thanks to Inception Security for the rclone prefetch image used above.